
Market volatility isn’t just about stock price swings; it’s a complex measure influenced by investor psychology, external events, and how we quantify risk. Many misunderstand it as simply market moves, but true volatility reflects how uncertain or fearful investors feel, often measured by tools like the VIX. If you want to grasp what really drives markets and how to navigate these fluctuations, keep exploring the factors behind volatility and what they mean for your investments.
Key Takeaways
- Market volatility reflects short-term price fluctuations influenced by investor sentiment, not necessarily long-term risk.
- The VIX index measures implied volatility from options prices, often misunderstood as predicting market crashes.
- High volatility can persist during stable periods and doesn’t always indicate impending downturns.
- Volatility varies across asset classes; stocks tend to be more volatile than bonds or real estate.
- Emotional reactions and behavioral biases often distort perceptions of risk during volatile market swings.
What Is Market Volatility and Why Should You Care?
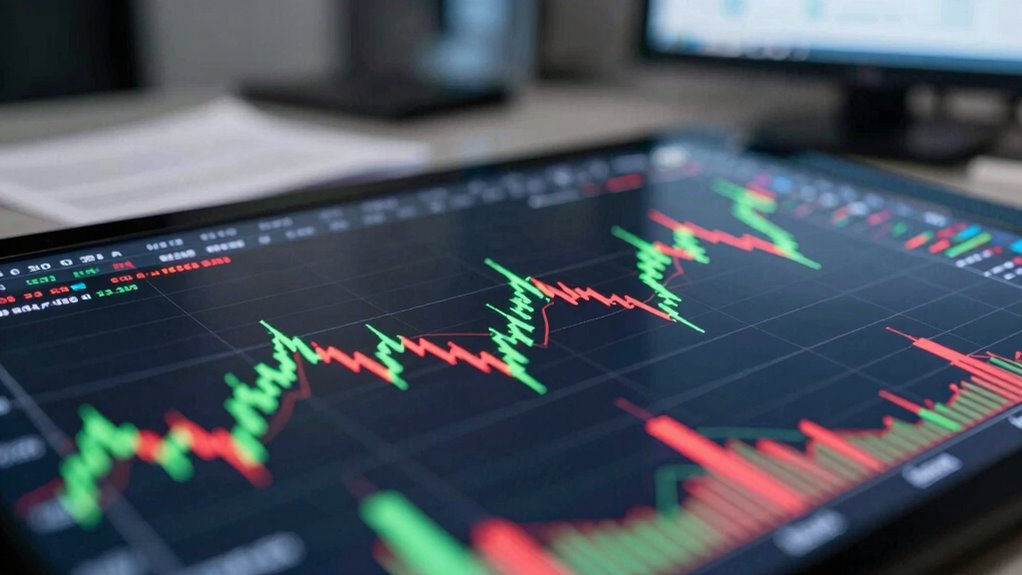
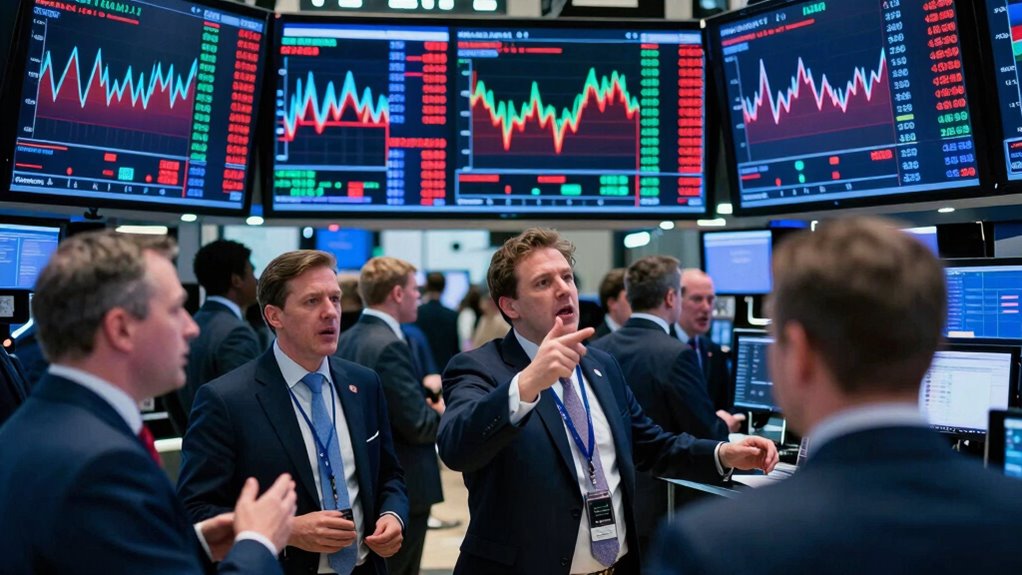
Have you ever wondered why stock prices swing wildly on some days but stay steady on others? That’s because of market volatility, which reflects how much prices fluctuate over time. Your investor psychology plays a big role here. Behavioral bias can cause you to overreact or panic during sharp moves, amplifying market swings. When you’re influenced by emotions instead of facts, you might make impulsive decisions, fueling the volatility. Understanding this helps you see that market swings aren’t just random; they’re driven by collective investor psychology. Recognizing how behavioral bias impacts your reactions allows you to stay more disciplined and avoid panic selling or buying based on short-term noise. Knowing why volatility happens helps you manage your investments more thoughtfully and avoid unnecessary stress. Additionally, market volatility is influenced by external factors such as economic indicators and geopolitical events, which can further amplify fluctuations.
How Do We Measure Market Volatility? Key Indicators Explained

Understanding how market volatility is measured starts with knowing the key indicators that track price fluctuations. One primary measure is historical trends, which analyze past price movements to identify patterns of volatility over time. These trends reveal how markets react during different economic cycles and help you anticipate future fluctuations. Investor psychology also plays an essential role, as market sentiment often drives short-term volatility. When investors feel anxious or overly optimistic, prices can swing wildly, reflecting collective emotions rather than fundamentals. Additionally, energy-efficient cloud servers can enhance data analysis capabilities, enabling more accurate modeling of volatility patterns. The integration of advanced data analytics tools allows for deeper insights into market dynamics, supporting more informed decision-making. Moreover, understanding the market structure and how different factors interact can provide a more comprehensive view of volatility sources. By examining these indicators, you gain insight into the underlying forces shaping market behavior. Recognizing these patterns helps you better interpret market movements and understand whether volatility signals genuine risks or just temporary emotional reactions.
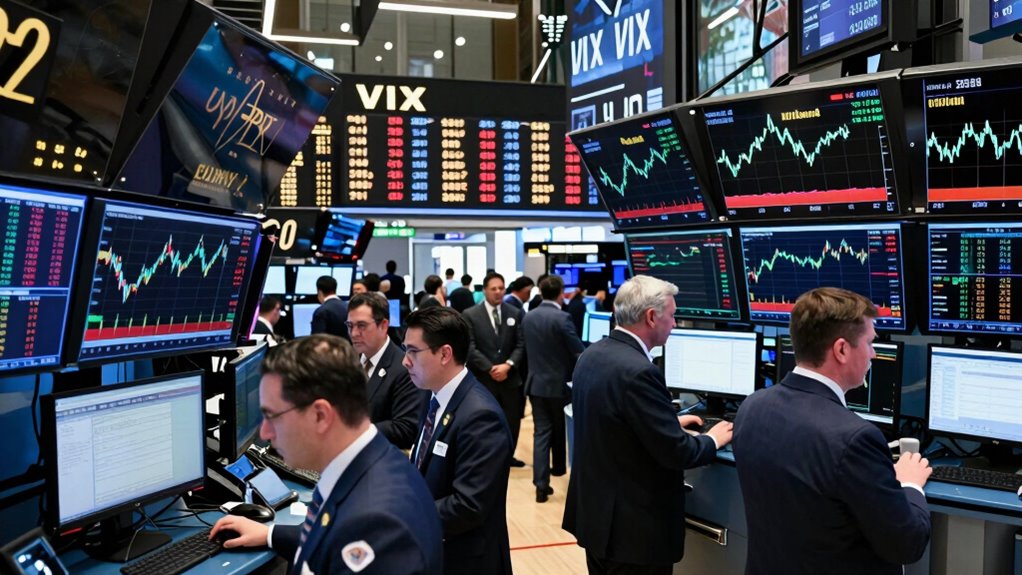
What Is VIX, and How Does It Reflect Market Volatility?
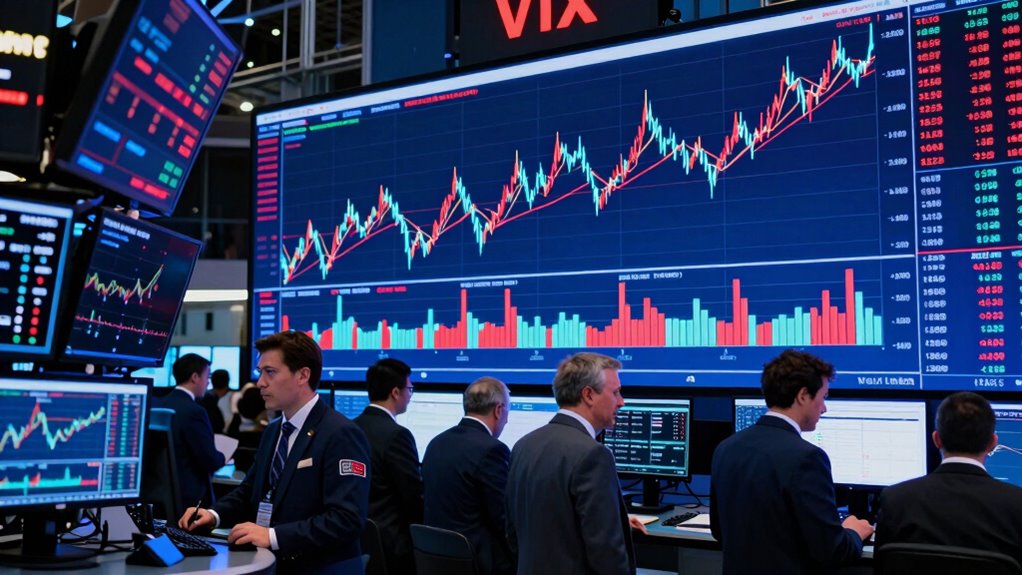
The VIX measures market expectations of future volatility by analyzing options prices. It’s calculated using a specific method that reflects investor sentiment about potential market swings. When the VIX rises, it signals increased market uncertainty, making it a useful indicator of overall market sentiment. Additionally, understanding market volatility can help traders and investors make more informed decisions during turbulent periods. Recognizing volatility measures can also aid in risk management strategies to protect investments. Being aware of volatility indicators such as the VIX allows for better anticipation of market shifts and can inform timely investment adjustments. Moreover, volatility metrics derived from options data provide real-time insights into how investors perceive risk, further enhancing market analysis. Informed traders often monitor volatility patterns to adapt their strategies accordingly.
VIX Calculation Method
VIX, often called the “fear gauge,” measures market expectations of near-term volatility by analyzing options prices. It does this through a complex calculation that focuses on option pricing, specifically looking at the implied volatility embedded in those prices. Implied volatility reflects the market’s forecast of future price fluctuations, derived from the premiums investors are willing to pay for options. The VIX calculation takes a wide range of out-of-the-money options on the S&P 500, weighting these options based on their strike prices and expiration dates. By aggregating this data, the VIX produces a single index value that indicates how much traders expect the market to move in the near term. Fundamentally, higher implied volatility means greater anticipated market turbulence.
Market Sentiment Indicator
Since the VIX reflects market expectations through its calculation of implied volatility, many investors see it as a real-time gauge of overall market sentiment. It captures investor psychology by indicating how anxious or confident traders are feeling. When the VIX rises, it signals increased fear and uncertainty, often coinciding with market drops. Conversely, a low VIX suggests complacency and confidence. Understanding this, you can interpret the VIX as a barometer of emotional market states. For traders and investors, recognizing the market sentiment indicated by the VIX can inform better decision-making during volatile periods.
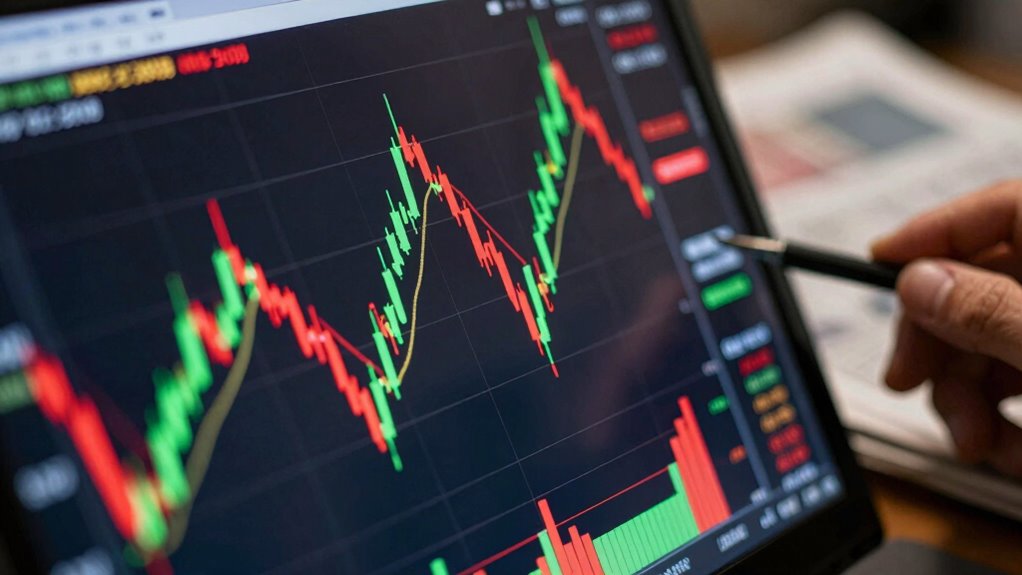
How Do Standard Deviation and Variance Show Market Fluctuations

Standard deviation and variance are essential tools for measuring how much market prices fluctuate over time. They are key statistical measures that help you understand the level of market risk and volatility. When prices move wildly, these metrics increase, signaling higher uncertainty.
To grasp their significance, consider how they:
- Quantify the typical deviation from average prices
- Help compare volatility across different assets
- Support better risk assessment strategies
- Illuminate whether market swings are normal or extreme
What Are the Limits of Using VIX as a Volatility Indicator?
While VIX can provide insights into market expectations, its predictive power isn’t foolproof. You should consider how different market conditions can influence its signals, sometimes making them less reliable. Also, keep in mind that VIX is more effective for short-term trends and may not accurately reflect long-term volatility. Additionally, understanding market sentiment analysis can help interpret market fluctuations more accurately. Recognizing the limitations of volatility measures like VIX can prevent overreliance on a single indicator in complex market environments. Being aware of how passive voice detection tools function can further enhance your comprehension of writing clarity and precision.
VIX’s Predictive Power
Though the VIX is often praised as a reliable gauge of market fear, its predictive power has notable limitations. It primarily reflects current investor psychology and options pricing, not future market moves. Relying solely on VIX can mislead you about upcoming volatility because:
- It reacts more to recent market shocks than to long-term trends
- It can stay elevated during prolonged periods of uncertainty without predicting crashes
- Investor sentiment can distort VIX readings, making them less reliable
- External factors, like macroeconomic news, often influence volatility beyond what VIX captures
- Additionally, market infrastructure can affect the accuracy of volatility measures like VIX
While VIX provides valuable insight into current market fear, it shouldn’t be your crystal ball. Use it alongside other indicators to better understand potential future volatility.
Market Conditions Impact
VIX often appears to be a straightforward tool for gauging market volatility, but its effectiveness depends heavily on prevailing market conditions. During times of heightened market psychology—such as panic or euphoria—VIX can spike sharply, reflecting widespread investor anxiety or complacency. However, in stable or low-volatility periods, it may underestimate true risk. Economic indicators also influence VIX’s reliability; sluggish economic data or uncertainties can trigger volatility not fully captured by VIX. Conversely, when markets are driven by sentiment rather than fundamentals, VIX might mislead you about actual risk levels. Therefore, understanding the broader market environment is essential. Relying solely on VIX without considering market psychology and economic indicators can lead you to misinterpret volatility and make ill-informed decisions.
Short-Term vs Long-Term
Understanding the limitations of VIX as a volatility indicator requires recognizing its strengths and weaknesses over different time horizons. For short-term trading, VIX can signal immediate market fear, helping you capitalize on quick moves. However, during extended periods, it might not accurately reflect underlying trends affecting long-term investing. VIX often spikes during short-term shocks but can remain subdued in sustained downturns or rallies.
- VIX is more reactive to recent news than long-term fundamentals
- Short-term traders rely on sudden volatility spikes
- Long-term investors need broader trend analysis beyond VIX
- Using VIX alone can mislead your perspective on prolonged market health
Why Price Swings Don’t Always Mean Market Risk

Price swings often catch investors’ attention, but they don’t always signal increased market risk. Your risk perception can be heavily influenced by investor psychology, leading you to equate volatility with danger. However, sharp price movements can occur during normal market adjustments, not necessarily due to fundamental problems. These swings might reflect short-term trading activity or reactions to news that don’t threaten the overall market stability. Recognizing this helps you avoid panic selling or overestimating risk based solely on volatility. Instead, focus on the context and underlying factors behind price changes. Not every jump indicates a crisis; sometimes, markets are simply adjusting to new information or normal fluctuations. Understanding this distinction is vital to making informed decisions and managing your investments effectively. Additionally, understanding market volatility as a complex phenomenon rather than a straightforward indicator can help you better interpret these movements.
How Different Asset Classes Show Volatility Differently

Different asset classes display volatility in distinct ways, influenced by their underlying characteristics and market behaviors. Your perception of volatility varies depending on the asset you’re tracking. For example:
- Stocks often show quick, sharp swings, making volatility seem high.
- Bonds tend to be steadier, with smaller, more predictable price changes.
- Commodities can be unpredictable due to supply and demand shifts, which sometimes results in rapid price fluctuations, especially during market shocks. Additionally, the credit card industry experiences fluctuations in consumer spending that can influence commodity prices indirectly.
- Real estate generally moves slowly, with less frequent but larger shifts.
These asset class differences shape how you interpret volatility. What feels risky in one class might be normal in another. Understanding these differences helps you avoid misjudging market risk and aligns your expectations with each asset’s actual behavior. For instance, market fluctuations in commodities can be more severe than in bonds, affecting your investment strategy. This perception is key to smarter investing.
How to Interpret Market Volatility for Smarter Investing

Recognizing how various asset classes behave during volatile periods helps you make smarter investment decisions. When market swings happen, understanding investor psychology is essential. Behavioral biases, like panic selling or overconfidence, can distort your perception of risk and lead to poor choices. Instead of reacting emotionally, interpret volatility as a sign to review your investment strategy. High volatility doesn’t always mean trouble; it can present opportunities if you maintain a disciplined approach. Keep in mind that volatility often reflects market sentiment rather than fundamentals. By staying aware of common behavioral biases, you can avoid knee-jerk reactions and make more rational decisions. Smarter investing involves understanding how market swings influence your mindset and using that awareness to stay focused on your long-term goals. For example, awareness of 1023 Jack can help you better grasp how individual investor behaviors impact market movements. Additionally, understanding the horsepower of electric dirt bikes can serve as an analogy for assessing energy and momentum in market trends. Recognizing the rhythms of market cycles can further help in interpreting when volatility signals caution versus opportunities. Developing a clear understanding of market volatility measures can also enhance your ability to interpret these fluctuations accurately and avoid misconceptions. Recognizing how different asset classes respond during turbulent times can provide valuable insights into managing your portfolio effectively.
Which Volatility Measures Are Most Reliable?
When evaluating market volatility, it is crucial to rely on measures that accurately reflect true risk rather than short-term noise. The most reliable measures consider phenomena like volatility clustering, where high-volatility periods tend to follow each other, and mean reversion, which suggests volatility often returns to normal levels over time. These concepts help filter out false signals and provide a clearer picture of real market risk.
You might find these measures helpful:
- Historical volatility: Tracks past price swings, capturing volatility clustering.
- Implied volatility: Reflects market expectations, often aligning with mean reversion.
- GARCH models: Account for volatility clustering and predict future fluctuations.
- VIX index: Measures market sentiment, smoothing out short-term noise for a more reliable gauge.
Frequently Asked Questions
How Does Investor Sentiment Influence Market Volatility?
Investor sentiment heavily influences market volatility because it shapes investor psychology and reactions to news. When sentiment shifts positively, you might see calm and steady markets, but negative sentiment can trigger sharp swings. Using sentiment analysis tools helps you gauge these changes early, enabling better risk management. Keep in mind, emotions drive many market moves, so understanding and monitoring investor psychology is key to steering through volatility effectively.
Can Market Volatility Predict Future Economic Downturns?
Market volatility is often a crystal ball, but it doesn’t guarantee future economic downturns. While historical volatility provides clues about past market swings, volatility forecasting helps identify potential risks ahead. You can’t rely solely on current market swings to predict a downturn, but rising volatility might signal increased uncertainty, hinting at future economic trouble. Stay alert and consider multiple indicators, not just volatility, for a clearer economic picture.
Are There Seasonal Patterns in Market Volatility?
Yes, seasonal trends influence market volatility, and holiday effects often lead to quieter trading periods. During holidays, trading volume drops, which can reduce volatility, but around major holiday seasons, you might see increased activity as investors reposition. These patterns vary each year, so staying aware of seasonal trends helps you anticipate potential shifts, especially during holiday periods when market behavior tends to differ from typical trading days.
How Do Geopolitical Events Impact Volatility Measures?
Geopolitical risks, political instability, and international conflicts all directly impact volatility measures. When these events occur, markets react quickly, increasing uncertainty and causing prices to fluctuate wildly. You’ll see heightened volatility as investors reassess risks, seek safety, and adjust their portfolios. These factors create sudden shifts, amplify existing trends, and make market movements less predictable. In times of geopolitical turmoil, volatility measures spike, reflecting the heightened risk environment you face.
What Role Do Central Banks Play in Market Volatility?
Central banks influence market volatility mainly through monetary policy decisions, like adjusting interest rates or engaging in quantitative easing. These actions can lead to currency fluctuations, which ripple across markets, causing increased uncertainty and price swings. When central banks signal changes or unexpectedly shift policy, you’ll see heightened volatility as traders react. Their actions directly impact investor confidence, making markets more unpredictable in the short term.
Conclusion
Understanding market volatility is like learning to read the weather—sometimes calm, other times stormy. By knowing what indicators to watch, you can navigate these turbulent waters with confidence, not fear. Remember, swings don’t always spell danger; they’re just part of the market’s rhythm. With sharper insight, you’ll steer your investments more wisely, riding the waves instead of being tossed by them. Stay curious, stay prepared—that’s your secret to thriving in any market weather.